
ReferAll’s Head of Development, Matt, has been working on a new project, developing our Outcome Reports solution. It’s now live for all customers. Matt gives the lowdown on what’s been updated, and why it’s a more user-friendly product.
The reporting function for ReferAll’s customers is a vital part of the platform. If you’re collecting data from your wellbeing scheme into our software, you of course need to be able to interpret the results. But we’re very aware our customers are not data analysts! Of course, there may be some who enjoy crunching the numbers, but for many those numbers only become useful if they’re presented in a way that’s very intuitive.
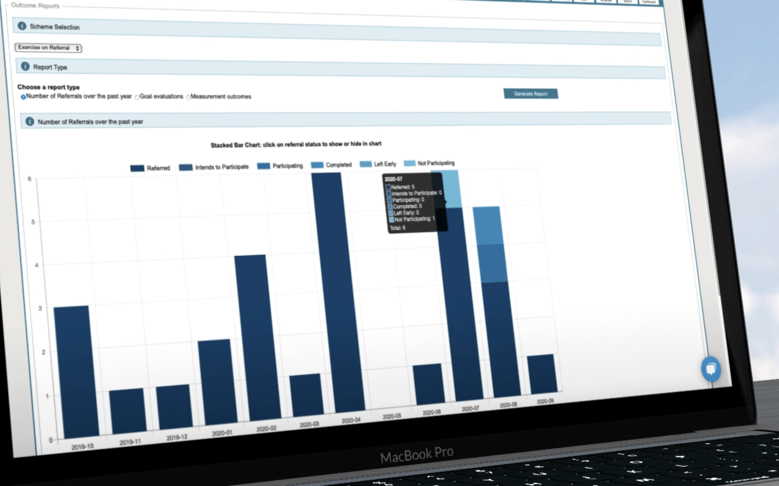
For me, this means being able to visualise results – it’s very powerful to be able to see something graphically. So I wanted to adjust how we presented data to our customers to make it easier to understand and generate results from, making reporting more graphical, more intuitive and therefore more effective.
We’ve taken our original Outcome Reporting solution and pivoted it in a way that means it’s much more accessible. By carving out this new implementation we’re now able to deliver real-time results to our audience within the same user interface.
Whereas our old reporting structure was very reliant on being ‘turned on’ and the correct configuration being put in, the new implementation isn’t. By default, everyone using ReferAll’s software to administer their schemes gets reporting for all the intervention points we have including weight, BMI, body fat percentage, BP, resting heart rate, waist to hip ratio (WHR) and many validated questionnaire scores such as SWEMWBS, IPAQ scores to name but a few.
Scheme administrators and managers can now also see the percentage change from one intervention point to another – and again it’s all available graphically. This means anyone can clearly identify the overall change their scheme has created, whether that’s a positive or negative slide. In real terms this means it’s simple to plot exactly the impact a scheme has had, and so – perhaps the most crucial point of all – prove to stakeholders what the service outcomes are. Even recording no change highlights that participants haven’t gotten worse, something which would have been very likely had they not started the intervention.
Our new Outcome Reporting solution isn’t just about making the analysis of your data more user friendly. Ultimately, it’s about being able to prove a scheme’s worth and use this to successfully compete for future funding.
Get in touch to talk through your reporting requirements. We’ll show you how ReferAll’s Outcome Reports saves precious administration time, month after month.
Warm regards,
Matt
Matt Langley
Head of Development